Visibility of devices, whether they are permanent or BYOD, is essential for any cybersecurity program. Recent research indicates that 85% of IT teams believe a lack of visibility is a point of weakness in their security program. Without visibility into the interconnectedness of network assets, security teams are unable to get a clear picture of how far-reaching a system vulnerability can be.
In vulnerability management (VM), visibility provides valuable context, including:
- Identifying and locating what assets and devices exist on your network
- Understanding how those assets and devices are connected within your network
Without visibility into the interconnectedness of network assets, security teams are unable to get a clear picture of how far-reaching a system vulnerability can be.
The ability to accurately visualize your network at any given moment is especially important in today’s dynamic cybersecurity environment. As infrastructures change over time, the legacy policies and rules established when they were first created can often get overlooked, providing openings for an attacker to gain a foothold in your network. As organizations move to Zero Trust and establish their ‘protect’ surface – the network’s most critical and valuable data, assets, applications and services – an outdated policy or rule could put those high-value assets at risk.
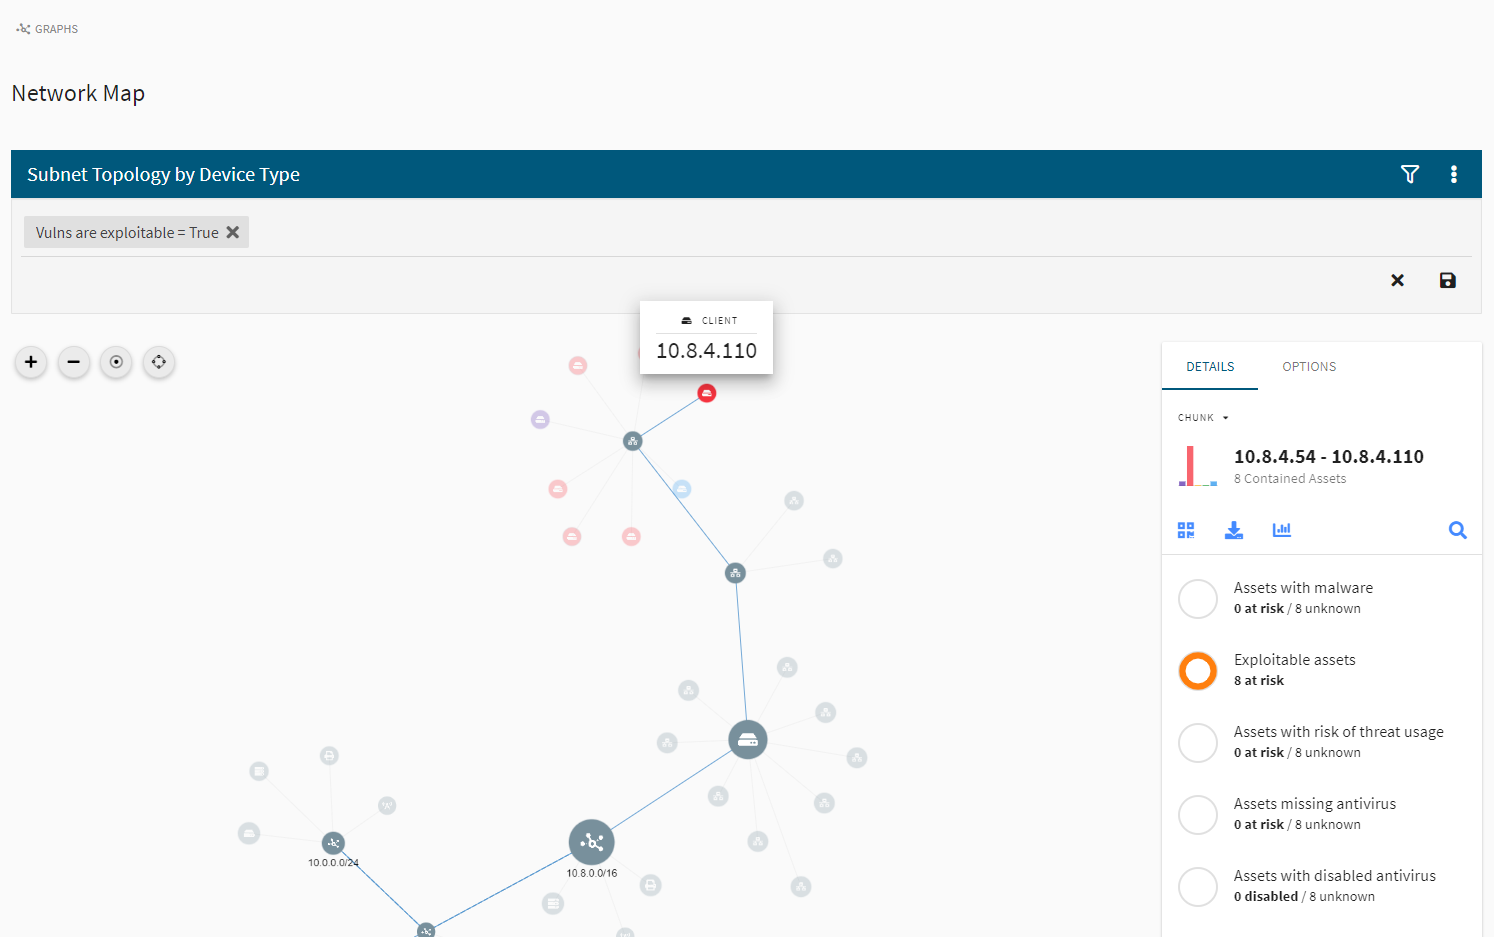
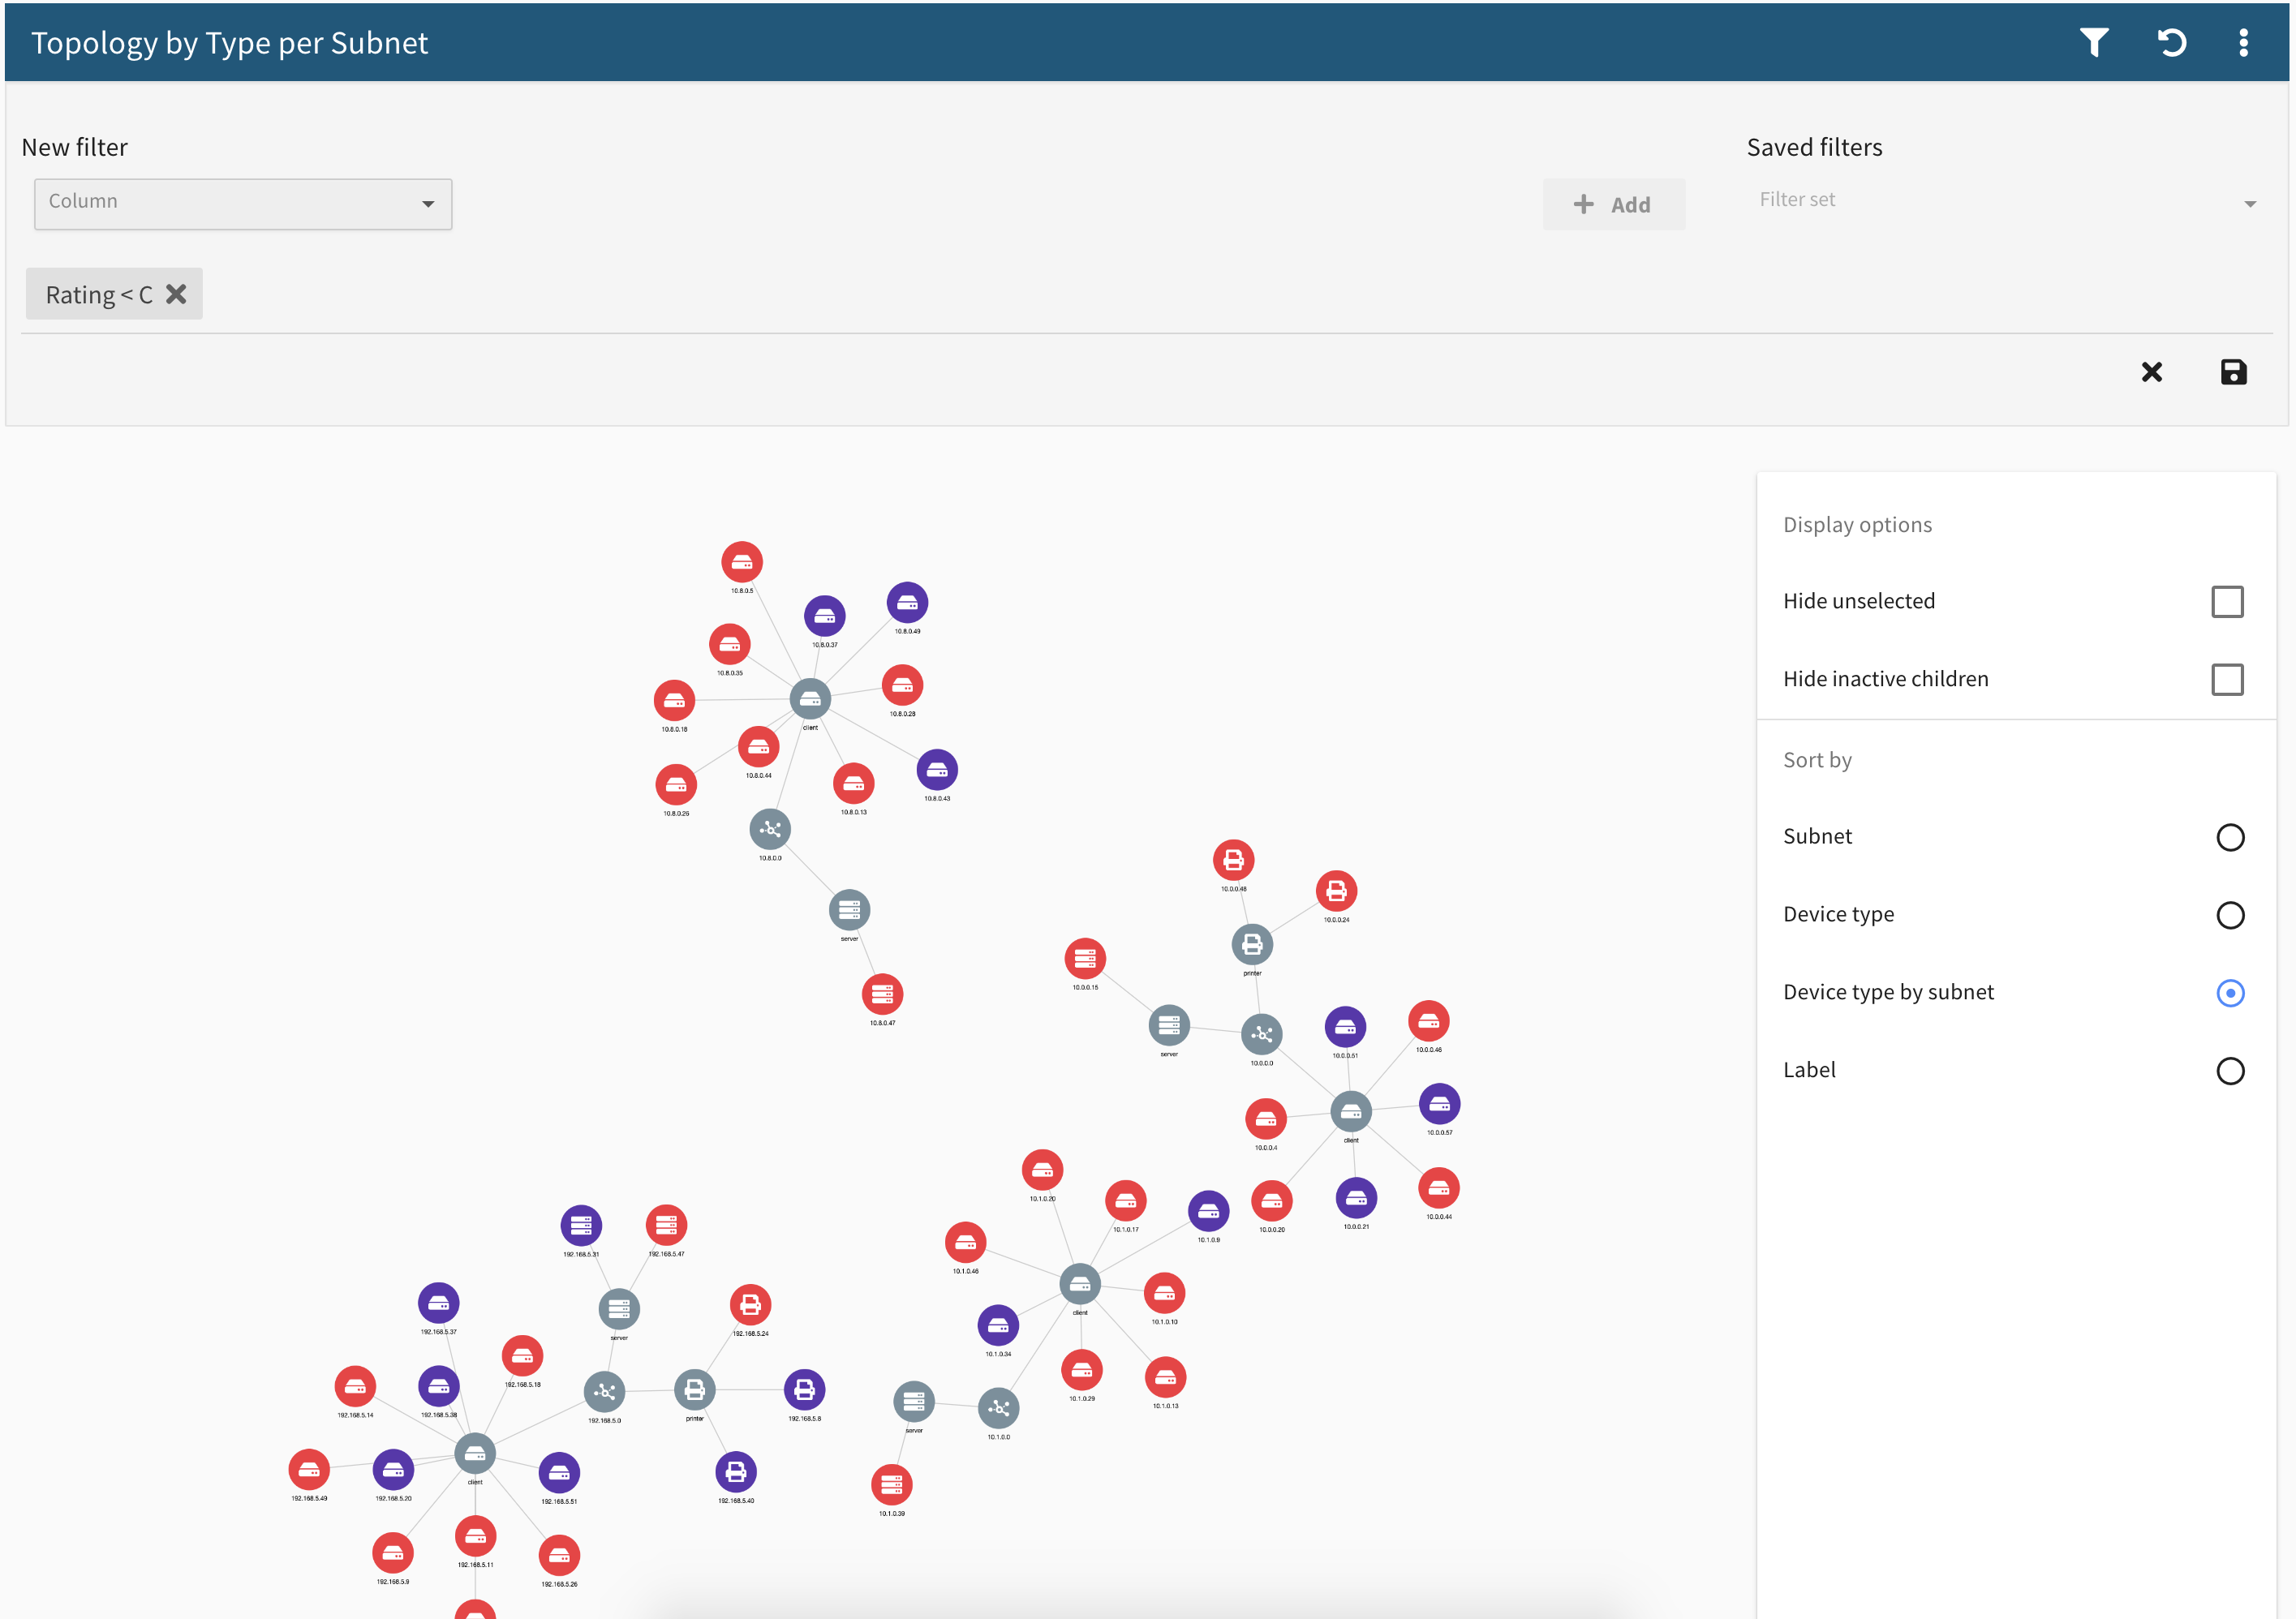
In the Frontline Network Map™ feature, network intelligence data that has been captured by Digital Defense over time is overlaid onto a pictorial representation of your network. This enables you and your team to view and interact with the relationships and interconnectivity of your assets. Through a variety of clustering algorithms, you can pinpoint at-risk network segments and areas of key vulnerability and active threat.
The Bigger Picture
Most security tools deliver vulnerability information in the form of lists that identify a weakness and, in some cases, rank its severity. Unfortunately, lists don’t provide a contextual view of how vulnerabilities affect the surrounding network components. Without a clear view of a vulnerability’s impact on other network elements, a security team doesn’t have the entire picture, making remediation prioritization less effective.
Network Map provides the visual context that can improve the impact of your VM program. When a vulnerability is exposed, Network Map shows which assets are affected. With a click of a button, you can easily drill down into that vulnerability and quickly see whether a single asset is at risk, or if a much greater number of assets are at risk.
Network Map’s accurate graphic depiction of risk enables rapid response to assets or network clusters that present the highest exposure.
Network Map’s accurate graphic depiction of risk enables rapid response to assets or network clusters that present the highest exposure. For example, your headquarters (HQ) subnet could be connected to a hub that contains a vulnerability that may appear as low-level in a list of vulnerabilities. However, from the Network Map view, you would see that the HQ subnet is displayed in red, indicating a critical vulnerability.
Your team can select the critical area of the map and discover that there are connections to the headquarters network that should not exist and serve as an opening to critical assets. With that information, your team can direct their attention toward HQ assets and address those vulnerabilities first.
Accountability Across Your Organization
Assessing the network of individual departments, locations, or business segments can also improve your overall security posture and drive accountability for security at a business segment level. Network Map displays your entire infrastructure so you can drill down into, say, the marketing group or finance group to assess their network and identify issues. Your team can then prioritize the efforts needed to improve the security of that individual area.
Support for Breach Simulation
Penetration testers and ethical hackers can also leverage Network Map to gain insight into breach simulation and attack path modeling. Because Network Map displays the information visually, a pen tester can see where an exploitable vulnerability connects to a cluster of assets adjacent to a more high-value cluster of assets. The pen tester can then demonstrate a valid attack path to your company’s mission-critical assets and establish how the connectivity and rules for those assets are at risk.
In Conclusion
The Frontline Network Map feature helps security teams prioritize vulnerabilities in a truly innovative way. To date, no major VM platform achieves the graphic granularity of Frontline Network Map. It comes as a standard feature in our Frontline.Cloud™ SaaS platform, so all users benefit from this powerful and simple approach to visualizing and taking action to improve your security posture. Network Map is available in Frontline Vulnerability Manager™ and Frontline Active Threat Sweep™.
See Firsthand How VM Can Work For You
Request a customized demo and see which cybersecurity vulnerability management options your organization needs.


